User Interface & Usage Manual
This application is still in development - use with caution!
Structural software is not a replacement for the knowledge of structural
design.
The application should only be used by a trained, qualified and experienced
engineer or for learning and training. All results must be checked by hand
calculations!
Structural Analysis EC3 Sizing+Optimisation Application for html5 and
JavaScript
Copyright (c) 2011-2014 Marko Nesovic, all rights reserved
Brief Instructions:
-You need at least some beams, some supports and some loads to run analysis
-To delete elements, double-click on them
-To improve performance use few auto-size members and fix the size of as many
beams
as possible by changing their type from auto to steel section
If you have any comments, please contact me on konstrct (at) outlook . com
By using this software you agree to the terms and conditions below
THE SOFTWARE IS PROVIDED 'AS IS', WITHOUT WARRANTY OF ANY KIND, EXPRESS
OR IMPLIED, INCLUDING BUT NOT LIMITED TO THE WARRANTIES OF MERCHANTABILITY,
FITNESS FOR A PARTICULAR PURPOSE AND NONINFRINGEMENT. IN NO EVENT SHALL THE
AUTHORS OR COPYRIGHT HOLDERS BE LIABLE FOR ANY CLAIM, DAMAGES OR OTHER
LIABILITY, WHETHER IN AN ACTION OF CONTRACT, TORT OR OTHERWISE, ARISING FROM,
OUT OF OR IN CONNECTION WITH THE SOFTWARE OR THE USE OR OTHER DEALINGS IN THE
SOFTWARE.
The user interface enables rapid development, testing and validation of the application. The UI enables graphical input of data (beams, supports and loading) as well as the graphical output of results.
The user interface is fully HTML5 based and include standard HTML elements, whereas a canvas graphical element (new to HTML5) is used for the display of graphical information and for graphic input. Interactivity is provided through JavaScript, which provides both interaction with forms and buttons as well as drawing within the canvas element and interactivity within the canvas. Konstrct.com utilises twitter bootstrap to improve the visual quality of the application and provide the necessary scalability for various screen sizes.
Visually, the aim was to keep the layout as simple as possible whilst providing all the required functionality. This was done so that the application does not appear cluttered and daunting to potential novice users but still enabling access to finer levels of input and accurate structural modelling and sensible sizing of structural elements.
The UI was structured to enable the application to be used both on a PC with keyboard and a mouse and on touchscreen phones and tables (iOS or Android based). It was tested in Mozilla Firefox, Chrome and Internet Explorer (later versions enabling HMTL5 support). No major incompatibilities between different systems were encountered.
As with most structural analysis applications, the UI is split into two main elements – input of data and output of results. The main input screen enables the user to select elements (in order to edit their properties) or delete them by double-clicking or double-tapping. It also enables the user to input the general information about the project such as name, ref number etc.
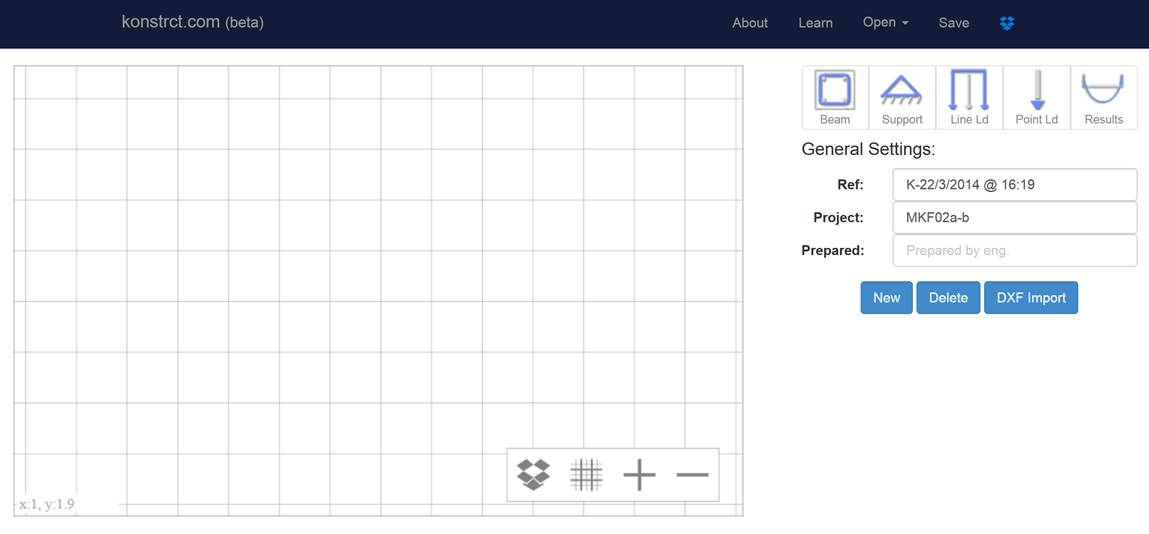
Figure 3‑11 - Main input screen
The structural elements available for input include beams, supports, line and point loads. All are inputted graphically by clicking on the main drawing canvas. By default a 1m major grid is enabled and all clicks are snapped to it. It is possible to turn it off and a 0.1m minor grid is also available for higher precision. The canvas can be zoomed in and panned. Using the minor and major grid as well as zooming and panning, it is possible to easily input and model various structural problems with 0.1m accuracy either on a PC or on touch-screen devices.
Numerical data/properties are inputted through a table/form displayed on the right hand side of the screen. The contents of the form changes to suit the currently selected element. Also, for beams, the form changes to accommodate different types of input required for defining different types of beams. Please see the forms reproduced below.
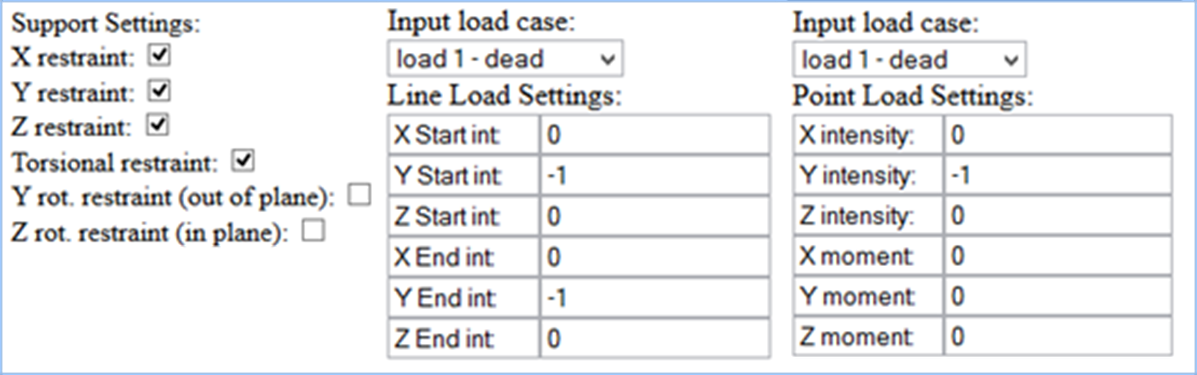
Figure 3‑12 Supports and Loading Input Forms
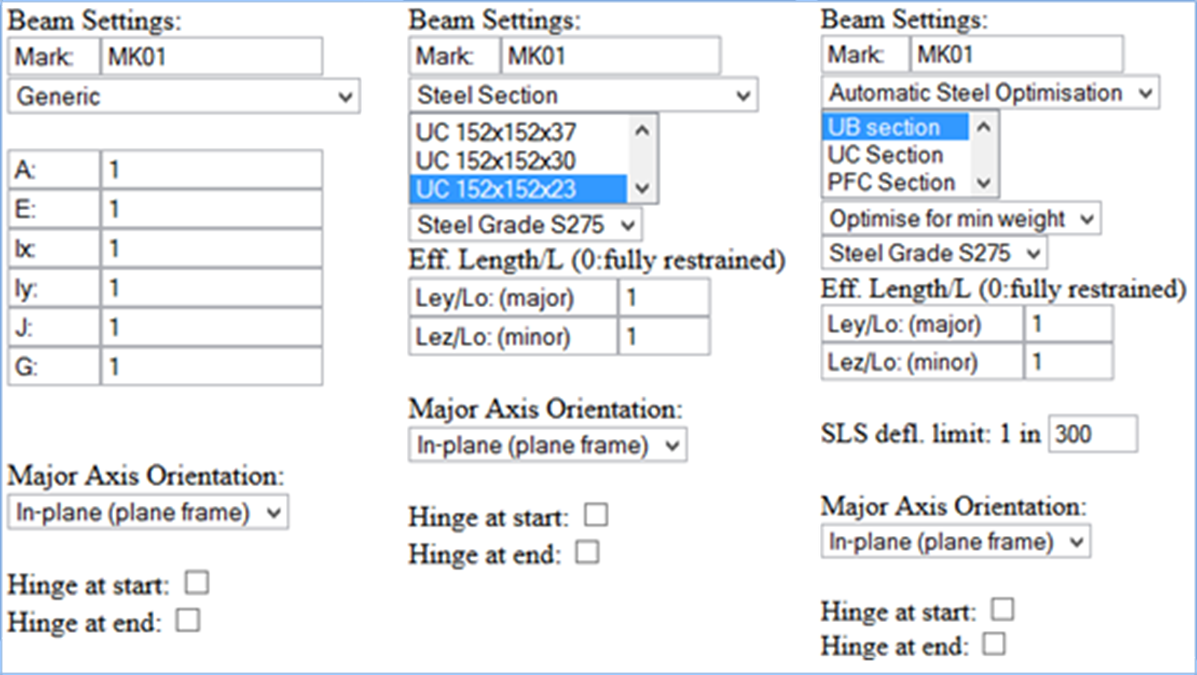
Figure 3‑13 Beam Data Input Forms
The application provides the following output:
- a. AxialForces
- b. Shear Forces (in-plane)
- c. Shear Forces (out-of-plane)
- d. Bending Moments (in-plane)
- e. Bending Moments (out-of-plane)
- f. Torsion
- g. Deformations (in-plane)
- h. Deformations (out-of-plane)
- i. Reactions
- j. Matrices:
- i. Structure Stiffness Matrix
- ii. Location Matrix
- iii. Load Vector
- iv. Member Matrices
- v.Global Displacement Matrix
- vi. Member End Forces (n.b. matrices are outputted with the selected input load case to enable output of lower level data such as member matrices, etc)
- k. Member Sizing
A single screenshot is presented below showing a typical bending moment diagram for a portal frame subject to a point load at mid-span.
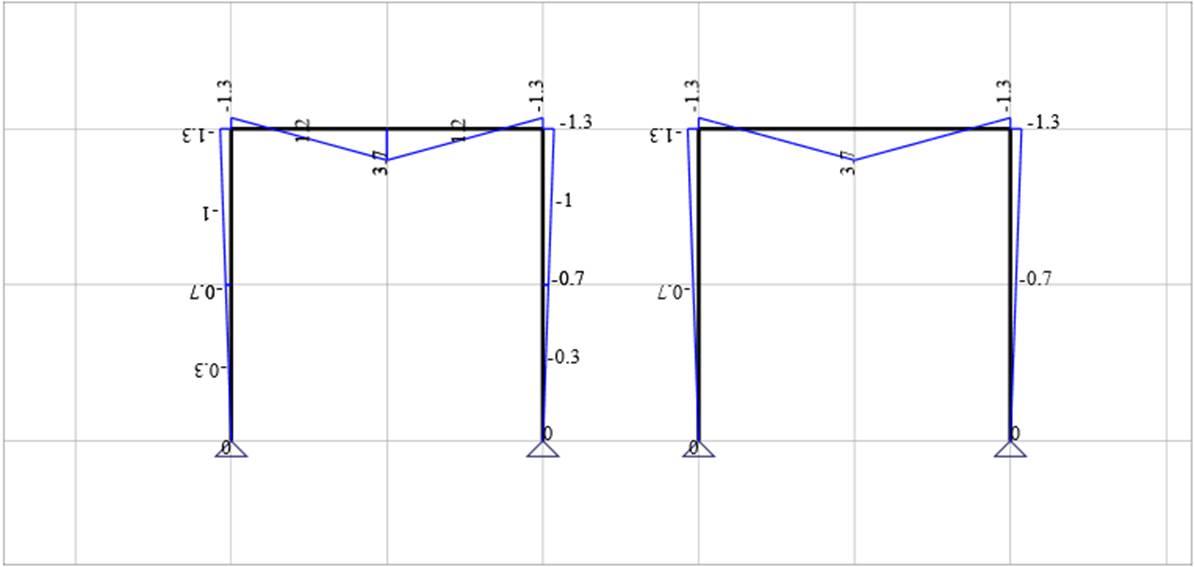
Figure 3‑14 Typical Output Diagram (BM diagram)
Treatment of frames and grillages
The main plane of the screen is treated as an x-y plane, and the z axis is taken to be perpendicular to it. Loading can be inputted in all three axis and results can be obtained in-plane and out-of plane. This enables the analysis of both plane frames and grillages depending on how data is inputted.
If loads are only inputted in the x and y axes, then the problem is a plane analysis case, and the user should only seek in-plane results. On the other hand, if loading is inputted in the z-axis, then the user should look at out-of-plane member forces. Obviously, it is possible to combine both and get results in both directions to analyse, for example, a frame subject to both vertical (gravity) and out-of-plane lateral loading (e.g. wind).
A switch within the beams input form allows the user to set the orientation of the beam, or more precisely, select whether the major axis of a beam sits in-plane or out-of-plane.